General Mills, audited.
15 of ~28 facilities (US scope)592 dock doors1,473 trailer spots7 rail-served
We core-sampled 15 of ~28 plants and DCs, We mapped the largest, rail-served, and highest-density US plants across the cereal, snacks, pet, and dough platforms; the gate pattern held across all of them.
Network size: General Mills FY2025 Form 10-K, Item 2 Properties: 42 facilities for the production of food products, 28 in the United States, as of May 25, 2025. https://www.sec.gov/Archives/edgar/data/0000040704/000119312525147079/d938443d10k.htm (2025-05-25)
Public audit. Not affiliated with General Mills. Data from satellite imagery + public records.
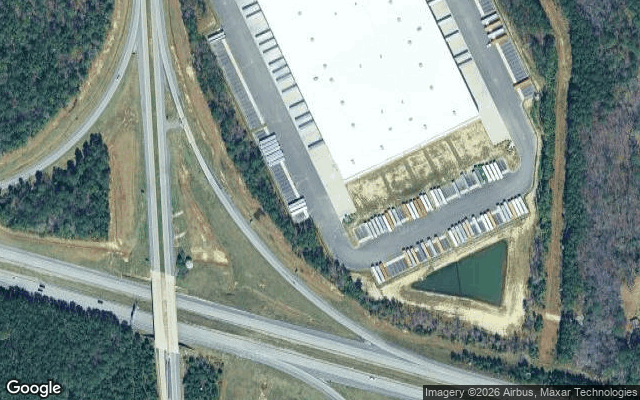
We audited General Mills’s yards from satellite.
Click any site for its gate, docks, and drop yards. No badge, no NDA, just what a driver sees.
General Mills’s stack is connected. The yards never were.
Your TMS runs the road. Your WMS runs the building. The yards are the tier between them, and they were never on the network.
Every truck gets re-keyed, re-queued, and re-found at each step. The lost time lives between the steps, which is why no single tool ever fixed it. The audit below is that gap, measured on your real yards.
A real audited site, played gate→dock→exit on the true yard geometry. Switch sites with the picker.
General Mills - Belvidere IL Distribution Center
No guard. Driver finds the call box, hits the buzzer, waits for someone inside to respond.
Movement durations are honest floors set by yard geometry; the uplift lands on the wait fields (queue + dispatch + secondary checkpoints). “Today” timings reflect the radios-and-clipboards world; “With YardFlow” reflects the protocol acting end-to-end. We may be wrong about parts of this, your actual numbers will tell us where.
What the handoffs cost across your network, and what removing them is worth
Read from satellite + Street View across all 15 facilities. At a comparable network, Primo Brands cut drop-and-hook turns from ~48 to ~24 min. Set your real volumes and margins in the calculator to put a number on it.
What surprised us reading General Mills’s network
Three patterns held across the sites we sampled. None of them show up on a facility list. All of them change how the yard runs.
- 01
Wellston OH is 328 acres of cereal manufacturing. Cheerios get made here at scale.
- 02
7 of 15 audited sites are rail-served. Inbound oats, corn, and sugar move on rail.
- 03
1,473 trailer spots across 15 audited sites. General Mills runs heavy trailer density for a CPG.
Turn what you saw into a number for finance
This audit is the evidence. The model is the math. Open the calculator seeded with General Mills’s audited yards, set your real volumes and margins, and it sizes the opportunity to the dollar.
This deep-dive is the evidence behind the /for/general-mills memo.
Are these your yards?
Tell us where we got it wrong, or see what 15 minutes of orchestration looks like on your worst site.
We are not asking for a pilot. We are asking for a conversation.
A 30-minute call, direct with Casey. We show you what we found across your yards, you tell us straight where it fits and where it does not. If the call goes well, we talk pilot. If not, you keep the analysis.
None of these times work? Email me at casey@freightroll.com or call or text me at 410-236-7434, and we’ll find one.
Casey Larkin, YardFlow. Jake, our founder, joins when it helps.