You have a passenger rating. Somewhere inside the ride-hailing app on your phone there is a number out of five that strangers gave you, that you have probably never looked at, and that quietly decides how fast a car shows up when it is raining. Your facilities have one of those too, and the people keeping it are drivers who lose money every hour they spend inside your fence.
Nobody mails you the report card. It arrives in your rate.
"Shipper of choice" gets talked about like a plaque for the lobby. It is not a plaque. It is a rating with a price attached. Carriers and their drivers keep it on their phones, and the thing that moves it most is how long a truck sits. That wait does not happen in your TMS (transportation management system) and it does not happen on the highway. It happens in your yards.
Somebody is already keeping score
Uber Freight published the numbers in November 2021 and it is still the clearest picture I have seen of what drivers think of the places they deliver to. Drivers rate facilities one to five stars on six things: wait time, amenities, flexible appointment, turning room, finding the entrance, and staff politeness. Uber Freight reported more than 2.1 million ratings of 86,000 facilities in the US. The overall average was 4.41 stars. Facilities where a detention occurred averaged 3.51 stars on pickups and 3.47 on deliveries, and Uber Freight found that a long waiting time can reduce a facility's rating by 1 or 2 score points.
Read the gap again. A long wait is worth a full star, sometimes two, against an average of 4.41.
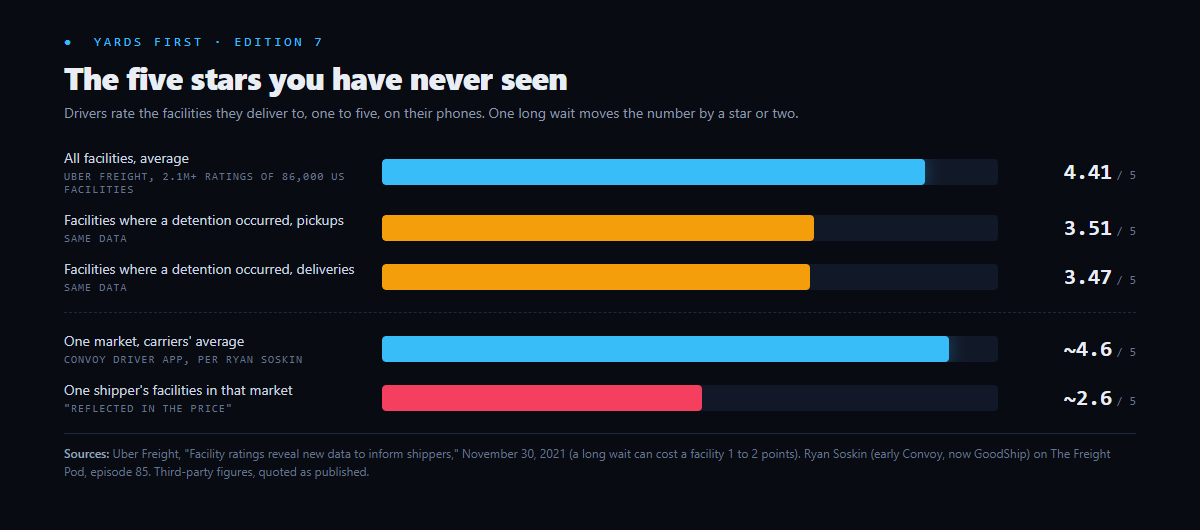
Ryan Soskin, an early leader at Convoy and now founder and CEO of GoodShip, described the same instrument from the inside on episode 85 of The Freight Pod with Andrew Silver. Convoy's driver app let carriers rate every facility one to five stars. He recalled one market where carriers averaged around 4.6 stars, and a given shipper's facilities in that same market ran near 2.6. His conclusion was not a moral one. If carriers do not like going somewhere, he said, that eventually gets reflected in the price.
That is the whole mechanism, and it has a price on it.
The wait is the score
Two years ago today, on September 10, 2024, ATRI (the American Transportation Research Institute) released its detention study on 2023 data. Drivers reported being detained in 39.3 percent of all stops. Not 39.3 percent of the bad stops. All of them.
The burden is not spread evenly, either. Women drivers reported detention in 49.1 percent of stops. Drivers pulling refrigerated trailers, 56.2 percent. Fleets that operate in the spot market, 42.5 percent.
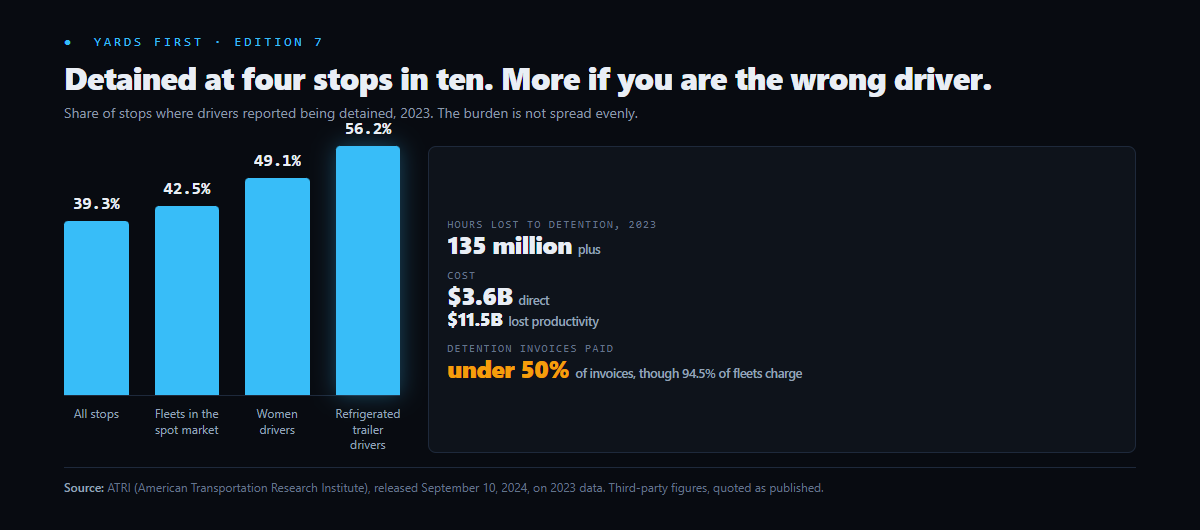
Depending on sector, ATRI found drivers were detained between 117 and 209 hours a year. Scaled up, the total time lost to truck driver detention exceeded 135 million hours in 2023. ATRI priced that at $3.6 billion in direct expenses and $11.5 billion in lost productivity from driver detention in 2023.
Now the part that should bother anyone who assumes the accessorial settles the account. ATRI found that while 94.5 percent of fleets charge detention fees, they are paid for fewer than 50 percent of those invoices. Detention typically runs $50 to $100 an hour after a two-hour free window, and it is collected about half the time. The rest is absorbed by the carrier and remembered by the driver.
Sit in the cab for a minute. The driver has 11 hours on the clock and a four o'clock appointment on the far side of it. They have been in your line for 90 minutes with the engine running, watching a guard shack window. They are not filing a complaint. They are doing arithmetic, and the answer is that your facility took the back half of their day.
What the wait does after the truck leaves
ATRI measured what happens next, and this is the finding I wish more executives had seen. Trucks that were detained drove 14.6 percent faster on average than trucks that were not detained. Drivers also drove faster on trips going to facilities where they had been detained before. They are trying to buy back the hour you took, and the only currency they have is speed.
FMCSA (the Federal Motor Carrier Safety Administration), citing a 2018 study from the DOT Office of Inspector General, put a safety number on that. A 15-minute increase in average dwell raised the expected crash rate by 6.2 percent. Every one-minute reduction in average detention nationwide could prevent roughly 400 crashes a year.
One minute. Four hundred crashes. That is the argument for caring about your gate, and it has nothing to do with rates.
The market repriced your reputation in July
Since early 2022 none of this cost you much. In a soft market the carrier takes the load anyway and swallows the wait. That window has closed.
DAT Freight & Analytics reported on July 9 of this year that dry van spot rates topped contract rates for the first time since February 2022. In its Dry Van Report on September 8, two days ago, DAT put dry van spot linehaul at $2.21 per mile excluding fuel, up 33.6 percent year over year and 21.4 percent above the nine-year seasonal average of $1.82, which DAT called near the top of the historical range. DAT's read in August was that the tightening is being driven by capacity exits rather than by a demand boom. Trucks left. This month's headline is that capacity is starting to trickle back.
Trickle is the operative word, and peak is next. FreightWaves' own analyst put it plainly this month: stabilizing at a high level does not mean the cycle is over.
The other number to watch is the one carriers use to say no. FreightWaves' Outbound Tender Reject Index counts the share of contracted loads that carriers turn down. In September 2024 it sat at 4.3 percent. On September 10 of this year FreightWaves put it at 13.45 percent, after it crossed back above 14 percent in the week into Labor Day, a bigger holiday jump than in any of the past three years. Roughly one contracted load in seven is being handed back, and the June peak, 17.64 percent, was the highest reading since March 2022. Refrigerated freight, where ATRI found the most detention, is also where FreightWaves shows the most rejection: 19.46 percent in early August.
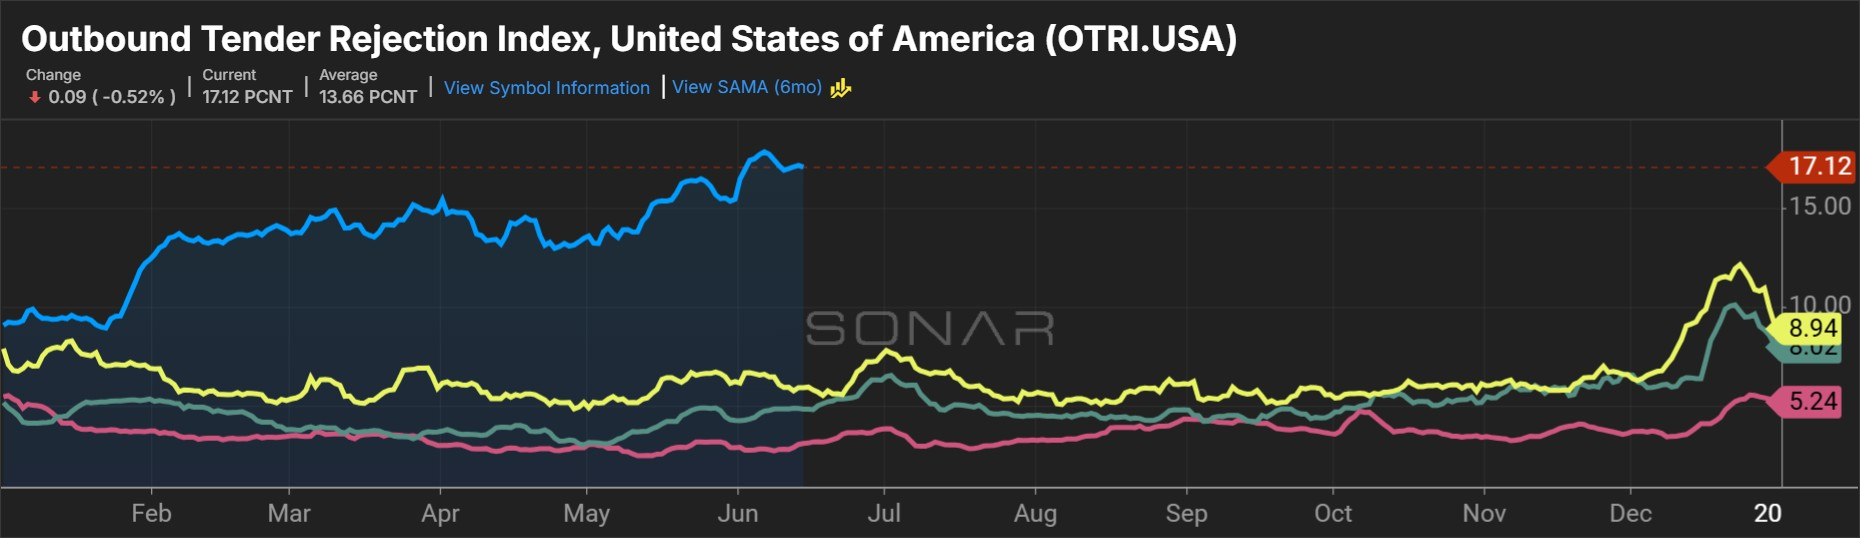
Chart: FreightWaves SONAR, Outbound Tender Rejection Index for the United States, 2026 in blue against 2025, 2024 and 2023, as of June 15, 2026. It has run between 13 and 15 percent since.
A rejected tender is a carrier telling you that, at your rate, your freight is not worth the trouble, and the trouble is measured at your gate. The load does not disappear. It falls down your routing guide to the next carrier, and when enough of them say no it lands on the spot market, where FreightWaves put the spread over contract near 51 cents a mile in July, the widest since 2021. FreightWaves reported in June that some shippers had been forced to rebid their entire book. That is what a facility score costs when the market turns: not a fee, a rebid.
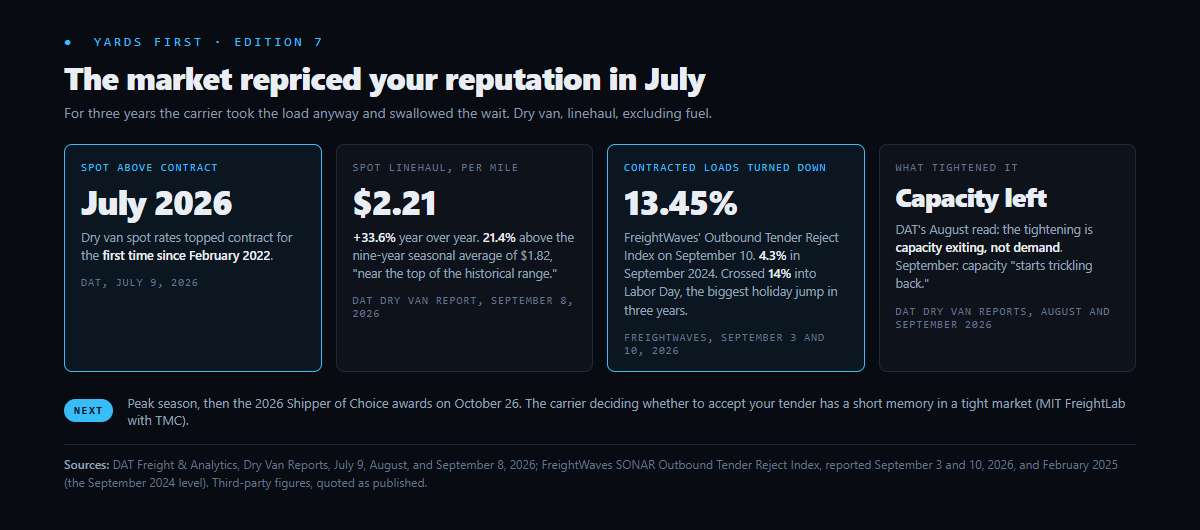
MIT FreightLab studied acceptance behavior with TMC, a division of C.H. Robinson, across two full market cycles from September 2015 to May 2019, published on C.H. Robinson's blog in June 2024. In tight markets, the strongest predictor of whether a carrier accepts your freight is how your contract price compares to that lane's market rate. Consistent, predictable demand comes next. And lower dwell times at facilities correlate with higher acceptance, while delays cause carriers to deprioritize a shipper's freight.
Then there is the line worth taping to a wall: in tight markets, carriers have short memories. Whatever goodwill you believe you banked by being reasonable during the soft market does not carry forward. The dwell does.
ATA (the American Trucking Associations) has measured large truckload driver turnover near 90 percent a year, 91 percent in 2019, with ATA's own caveat that the figure more accurately measures drivers moving between carriers than drivers leaving the industry. Either reading lands in the same place for you. The driver who sat in your line last spring is at a different carrier now, and the memory of your gate went with them.
The score is set in the yards
The wait is not on the highway. It is at the guard shack while somebody looks up an appointment. It is in the paperwork handed through a window twice. It is in the half hour between arriving and being told which door to back into. Every one of those minutes is created inside your fence, by your process, on your property. Every one of them is scored by somebody with a phone.
The 2026 yard survey from C3 Solutions found that driver experience is important or extremely important to 87.1 percent of respondents, and it connects driver wait times, communication quality, and how freight moves through the yards to carrier relationships and service reliability. The industry already agrees this matters. What the yard survey keeps finding is that agreement is not instrumentation.
Here is what we do about it, held strictly to what is running today. At our customer sites a driver checks in from their own phone, with no app to download. The dock signs the BOL (bill of lading) on a screen. The gate-to-gate time of every truck is a timestamp in the record rather than somebody's guess at the end of the week. That driver journey is live at 24 sites, and a measured before-and-after at one of them cut drop-and-hook turn time in half.
The tooling is not the point. The point is that you cannot manage a rating you have never seen, computed from a number you do not keep.
FreightWaves gives an award for exactly this. Its Shipper of Choice award recognizes shippers fighting driver detention and providing accessible facilities, and it judges on data connectivity, ease of doing business, strong relationships with carriers, and effective facilities management. The 2026 winners are announced on October 26. Anyone in the industry can nominate, which tells you who the real judge is.
Where this argument stops working
I want to be honest about the edges of it.
If you run a private or dedicated fleet, the price mechanism I have described mostly does not reach you. Your trucks show up because they are your trucks, and the rate does not move. Your drivers still quit, though, and a driver who loses 90 minutes a day waiting at your own facilities is one you will be recruiting against, at your own gate.
If you hold captive lanes, freight nobody else can realistically haul, you can be a difficult facility for a long time and pay almost nothing for it. That is real. It is also a smaller share of your network than you think, and it is not where your Q4 exposure lives.
And if you are already paying well above market to buy acceptance, you have solved the tender problem with cash. The MIT FreightLab and TMC work says price is the strongest lever in a tight market, so it works. Be clear about what you are buying. You are renting acceptance at a premium, every year, instead of repairing the thing that made it expensive.
Three things you can do tomorrow
Pull August arrival-to-departure times by site and rank them. Not the average, the ranking. If you do not have the times, pull the detention invoices instead, and know that invoices only show the waits somebody bothered to bill. The site at the top of that list is the site your carriers are already pricing, and now it has a name.
Ask three carriers which of your sites their drivers ask not to be dispatched to. They will tell you. Almost nobody asks them, and the answer comes back faster than any survey you could commission.
Ask your broker or your digital freight platform what their drivers score your sites. The platforms hold it. The analysis Uber Freight published in 2021 drew on more than 2.1 million ratings, and your facilities were in somebody's data that day too.
Peak is six weeks out. Between now and January, every tender you send goes to a carrier deciding, load by load, whether your facilities are worth the trouble at the price you are offering. Most of that decision was made long before your load hit the board. It was made by a driver, at your gate, on an ordinary Tuesday, with the engine running.
You cannot argue with the score. You can change what it finds.
Reply to this edition and tell me which of your sites is the expensive one. If you are willing to name the number it is costing you, I will tell you what we have seen at sites that went after it.
Jake Koppinger Co-Founder and CEO, YardFlow by FreightRoll
Reply on LinkedIn, where the comments are (opens in a new tab)