A restaurant on a Friday night lives and dies on the table turn. Every good operator knows the number, watches it all night, and can tell you by eight o'clock whether the room is running fast or slow. No owner has ever deposited a table turn. What the restaurant sells is covers, and the turn is only the mechanism that makes the next one possible.
Yards work the same way. Almost every business case I read for the yards stops at the turn.
The first edition of this newsletter reported a measured result: 48-minute drop-and-hook turns became 24, same gate, same trucks, measured side by side. It is a real number and I stand behind it. It was also the smallest thing that happened...that led to the biggest.
The minutes were never in the driving
Ask where the time came from and the answer is not the driving. The compression sat in the wait, the driver queue and the dispatch lag, not in the physical move. The truck did exactly what it did before.
The wait was made of people talking to people. In yards that still run on paper, the driver pulls up, waits for a guard or a dock-office employee, identifies themselves, confirms the load, receives instructions, finds the drop or hook, returns to the office, provides seal information, wet-signs paperwork, takes copies, leaves one behind, waits again, and exits. Two trips to a window and a stack of paper, for one truck.
The 2026 yard survey of 149 supply chain professionals put inefficient manual processes at the top of the operational challenge list, at 40.3%. Those are practitioners describing their own operations. Nobody measured them. That gap between what an operation reports and what it can prove is going to matter in a minute.
Take the window visits out and most of what the wait was made of goes with them. In our own ROI model, check-in and check-out fall from nine minutes a shipment to three. The same model assumes a yard management system on its own takes that nine to eight. Those are our assumptions, not a benchmark, and the gap between them is the whole point: organizing the yards is not the same move as removing the window.
For the driver, that is the whole job. Get in, drop the load, get back on the road.
The stack most business cases stop halfway up
Here is our own ROI model, run against its default fifty-site network, sorted by what each layer is worth in a year. Every share below is modeled:
Paper: about 1% of the annual value.
Detention: about 1%.
Dock-office labor: about 2%.
Spotter labor: about 3%.
Trailer pool and panic freight: about 11%.
Realized production capacity: about 82%.
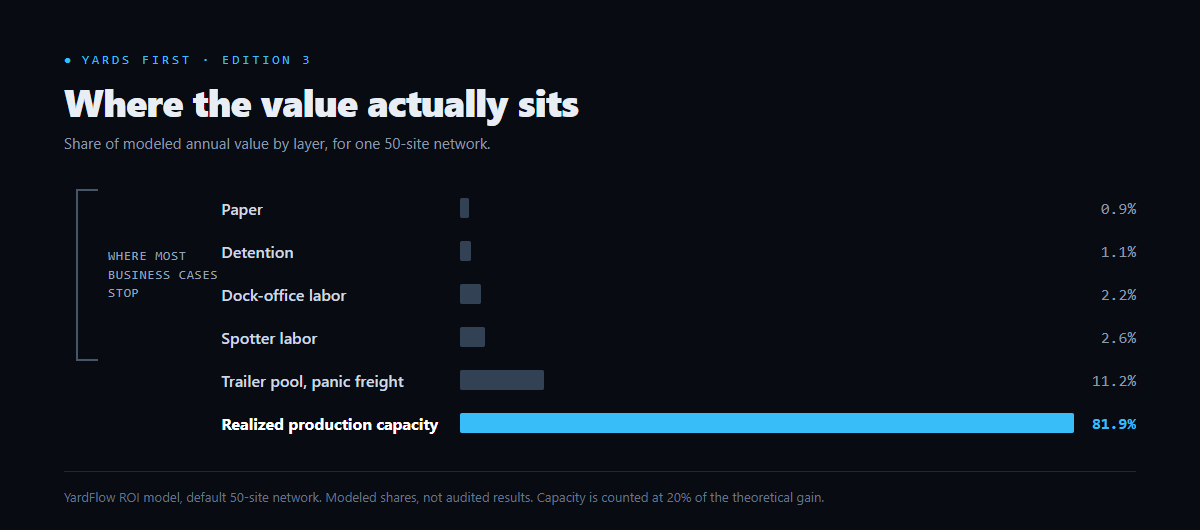
Those are modeled shares on an illustrative network, not anyone's audited results. The proportions are the point, not the dollars.
Most business cases for the yards are built entirely out of the first four lines, because those are the countable ones. You can count pages, claims, and heads. Together they come to under a tenth of what the model says is on the table. The paper line alone still covers the software subscription in that model, which is why paper is such a good first wedge and such a bad final answer.
The top line is the one almost nobody prices, and it is not a rounding error. It is four fifths of the number.
Before you take that at face value, here is where it breaks. That top layer is only worth something if you can sell what it frees up. A plant that cannot fill the volume it already has does not get four fifths of anything, and the stack collapses back to the cost lines. The layer also scales directly with margin per shipment, which in our version is a round number we chose. Cut that assumption to a quarter of what we used and the top line drops from about four fifths of the stack to about half. It is still the biggest line. It is no longer the whole argument.
So if your yards are not the constraint on what you ship, say so plainly and run the cost case. If they are, the cost case was never the case.
Why the top of the stack is not a spreadsheet fantasy
A model that conveniently finds its biggest number in the hardest place to verify deserves suspicion. So two things.
First, our model is deliberately conservative here. It counts only 20% of the theoretical capacity gain as realized. Four fifths of the arithmetic is thrown away before a number goes in front of a CFO, and the layer still dominates the stack.
Second, we have an observation, not arithmetic alone. In the network where we measured the turn, the sites running the standardized driver journey moved about 5% more volume than comparable sites without it, on the same dock-office headcount. Volume moved, counted.
I am not going to tell you the minutes caused the volume. No two sites are identical and one observed comparison is not a controlled trial. What I will tell you is that the direction survived contact with a real network: the sites that stopped making drivers wait moved more product, without adding people to the dock office.
Their own dock operations leadership put it in writing:
"...your software has enabled us to take on additional volume while remaining headcount neutral in the dock office. That was an integral part of our strategy and has been proven."
Read that for what it does not say. It does not say anyone was cut. It says they absorbed more volume with the people they already had, and that this was the plan going in, not a happy accident on the way out.
That distinction is the whole edition. A cost saving makes the same volume cheaper. A capacity gain lets a plant sell what it could already make. They are both good. They are not the same size, and only one of them shows up in the revenue / gross margin line.
The question worth asking this week
Find whoever owns the business case for your yards and ask one question: what is on the top line?
If the answer is pages, detention claims, and dock labor, the case is honest and it is truncated. Those are the layers you can count before lunch. The top line is a different question: what could the operation ship if the yards stopped being the constraint, and has anyone ever put a number on it? In most conversations I have, nobody has even considered the yard as a major constraint. And the person who could answer it does not sit anywhere near the yards, which is the real problem: a business case written by the person who owns the yards is guaranteed to stop at the lines that person controls.
If nobody has, it is four numbers, and you already have all of them. Take your annual shipments. Multiply by your margin per shipment. Multiply by the percentage you think faster throughput would add to what you can move in a day. Then, because you should not believe your own best case, keep a fifth of the answer and throw the rest away.
That last step is not false modesty. It is what our own model does, and it is why the top line survives arithmetic that is hostile to it.
That number is the reason to do this work. The minutes are how you get it.
The full sequence, and the research the model is built on, is here: yardflow.ai/order-of-operations
Every edition: one beat from the research, one measured number, and what it means for the people who own yards.
Jake Koppinger, Co-Founder and CEO, YardFlow by FreightRoll
P.S. If you go ask that question, tell me what came back. I am collecting the answers, and the ones where nobody could produce a top-line number at all are the ones I want most.
Reply on LinkedIn, where the comments are (opens in a new tab)